One issue discussed in Cheng, X. et al. (2018, https://arxiv.org/abs/1806.06850v2), is the extrapolation issue in some statistical models such as polynomial regression and neural network (NN). Since NN is a form of polynomial regression, we can easily demonstrate this virtually as two dimensional (x, y) data. This article explained this phenomenon very well. The following graph is particular relevant:
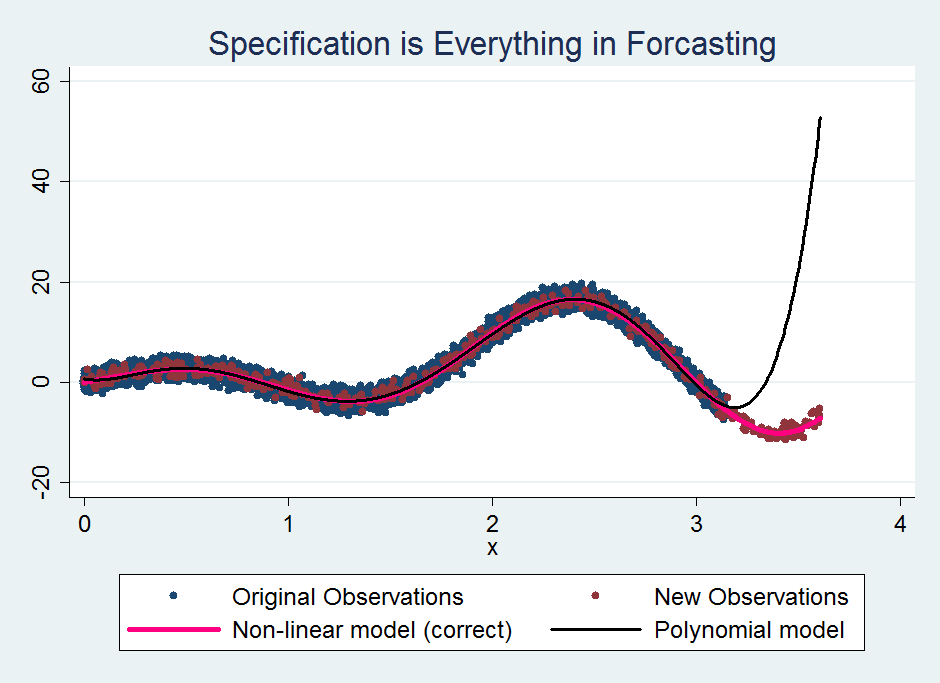
The true model takes the form y =5*x*sin(1+2.95*x)+2*x. Using the non-linear model taking exact this form would obtain good prediction results, as expected. Another choice is polynomial regression which in this case takes degree six polynomial terms. As we can see, within the original data range, the polynomial model predicts well. Beyond the boundary, not so well.
Nevertheless, it could be argued that within certain range the two functions are equivalent. This can also be explained by the following two examples. The first originated from the famous Basel problem: Euler had shown that this series (a Riemann zeta function ζ(s)):

equals to π2/6.
More generally, this equation holds when n is positive integer:

where B2n is the 2nth Bernoulli number.
In other words, the two function are equivalent only when n is a positive integer.
As another example, it can be shown that when |r|<1:

In other words, within the range of (-1,1), the two functions of r are equivalent.
Therefore under this condition, i.e. when the predictors used for forecasting fall in the same range as with the training set, one may be comfortable with such prediction as the complex models (polynomial regression, NNs) may indeed approximate the true underlying function well. The trouble is when you have lots of predictors, some combinations of predictors may not within the “range” that the model had seen, leading poor prediction. For example, the training dataset may contain both high and low values of two predictors x1 and x2, but the data may not contain any case when x1 is high but x2 is low. This may explain why many complex “machine learning” models are data hungry as the model needs to see all possible scenarios in the data.
This extrapolation issue also reminds us the importance of extra effort of looking for the “true” model. It is said the definition of “machine learning” is computer scientists who don’t know much about statistics trying to do data analysis. While this view is a bit extreme, but any statistician can tell you that it is not very common that the sole purpose of building a model is prediction. It is one thing trying to automatically recognize vehicle plate number so as to implement a toll system, it is another to rely on a black-box model to understand the world with possible severe consequence.
While statisticians would always trying to find what really is going on, the data scientists seem to have given this up and only concerned with predictions (within some laboratory settings). Recently I came across this interview video which discussed what went wrong with Hillary Clinton’s campaign (particularly from 11:50).
It is interesting the author (who witnessed the campaign throughout) highlighted that Bill Clinton, a political campaign expert, repeatedly flagged the issue of white working class but Hillary’s team was so obsessed with their data analytic model which was called Ada, “a complex computer algorithm” and “run 400,000 simulations a day” as reported by Washington Post (while on the other hand Nate Silver used a much simpler model and got the best prediction). Ada, or the people who used it seemed insane, as they blindly believing the model for no good reason while not listening to a political expert who flagged what might got missed by the model. A statistician on the other hand would almost always respect experts with domain knowledge and make an effort of reasoning their model. Their Ada, I suppose like many other “machine learning” systems, could be difficult to interpret (that is why they need to run so many simulations a day), and thus difficult for Hillary to find out how to improve. Yes my model may say I have a very high chance to win the election although I am not quite sure why. Is it good enough? This is almost useless in my opinion as the most important thing is to know how to increase the candidate’s chance even the model already “predicted” you would win. This is exactly what the good old statistical models were doing: can smoking increase my chance to get a cancer? Does drinking coffee two cups a day increase or decrease my life expectancy?
Even the media who overwhelmingly support Hillary and thought she would win comfortably on a wide margin did not actually bother too much with the prediction reported by various statisticians, data scientists, machine learning experts either. The morning after the election I woke up and read a reputable media outlet, and the author admitted that, as with such events previously, they just prepare two articles/front pages, one if candidate A wins, another if candidate B wins. Then no matter who wins, you can always quickly publish your article or print your front page in time (to be fair though, this author’s Trump version article he prepared was much shorter than Hillary version…). Black swans do happen. There is not much point of predictions but this sort of scenario analysis or insurance* would serve you better.
* for example I predict (with high confidence) that I will not be involved in an accident when having a holiday abroad but I would buy a travel insurance.


2 thoughts on “Visually explaining the extrapolation issue and why it is important to understand the underlying mechanism”